Cannot debug hypervisor

I'm using WinDbg to debug my hypervisor. But seems like reliance of interrupts causes issues. This has never happened before. When I put a breakpoint to anywhere in my host code, the WinDbg successfully hits the breakpoint. But after a few instructions of assembly, WinDbg freezes for 30 seconds. Saying "busy". And then, I'm welcomed with a page fault because stack is somehow trashed and my VmExit handler is triggered.

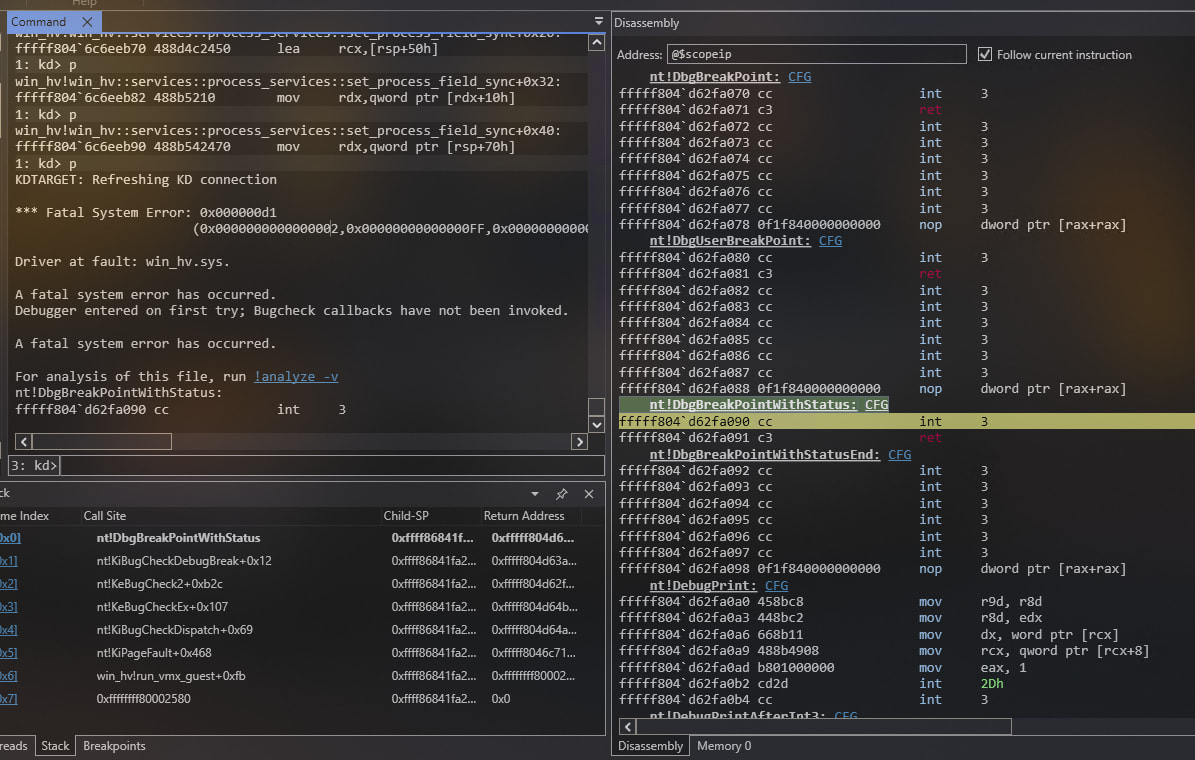
The run_vmx_guest on the stack is where the guest register restoration happens. And due to its reliance on stack, and since stack is garbage, it page faults.

The problem doesn't happen when a breakpoint isn't put. It works perfectly fine even whee WinDbg is attached. Everything goes wrong after hitting a breakpoint.

I haven't tinkered with host IDT or something. It's same as the normal IDT. This issue didn't happen before. It just began.

Try this, do your development in an emulated QEMU virtual machine. Connect windbg to the QEMU gdb interface using the windbg exdi adapter (it works pretty well with qemu). I’ve done things like this on ARM64, but think this all works on x64 too. So then the windbg stub does not run on the target machine, it has run control and memory read/write thought the qemu gdb stub, so you can single step through interrupts or whatever. It’s not quite an nice as native windbg, but can debug situations that normal windbg can’t. I’m not sure windbg will be so happy when you change VMs, but with the exdi interface you could refresh the connection and get windbg to get it’s context synced for the new vm context.

1 Like

How do we setup the exdi? I couldn't find any working guide on it.

Okay. So, I figured it out EXDi. However though, I still cannot debug it.

00 ffffb681`2eca1e88 fffff803`16bf173d     kdcom!READ_REGISTER_ULONG+0x5
01 ffffb681`2eca1e90 fffff803`16bf3ad5     kd_02_8086!ReadDeviceMemory+0x71
02 ffffb681`2eca1ed0 fffff803`16bf34be     kd_02_8086!E2500InDword+0x39
03 ffffb681`2eca1f10 fffff803`16bf3858     kd_02_8086!e1000_UNDI_Status+0xbe
04 ffffb681`2eca1f50 fffff803`16bf18f1     kd_02_8086!e1000_UNDI_APIEntry+0x138
05 ffffb681`2eca1f80 fffff803`16bf1079     kd_02_8086!UndiGetRxPacket+0xb9
06 ffffb681`2eca2190 fffff803`16c6d49f     kd_02_8086!KdGetRxPacket+0x9
07 ffffb681`2eca21c0 fffff803`16c6d92f     kdcom!WaitForRxPacket+0xef
08 ffffb681`2eca2230 fffff803`16c6d68b     kdcom!WaitForSpecificRxPacket+0xf7
09 ffffb681`2eca2290 fffff803`16c6d9e2     kdcom!WaitForSpecificRxIpPacket+0xb7
0a ffffb681`2eca2360 fffff803`16c6b1ff     kdcom!WaitForSpecificRxUdpPacketEx+0x6e
0b ffffb681`2eca23e0 fffff803`16c682c3     kdcom!NetReadKdPacket+0xcf
0c ffffb681`2eca2490 fffff803`16c688d8     kdcom!KdReceivePacket+0x153
0d ffffb681`2eca2550 fffff803`85d6a3ce     kdcom!KdSendPacket+0x2a8
0e ffffb681`2eca25e0 fffff803`85d6a2f0     nt!KdpSendWaitContinue+0xa2
0f ffffb681`2eca26b0 fffff803`856d598e     nt!KdpReportExceptionStateChange+0x110
10 ffffb681`2eca2810 fffff803`85d6546b     nt!KdpReport+0xca
11 ffffb681`2eca2850 fffff803`8545eaaa     nt!KdpTrap+0x1b3
12 ffffb681`2eca28a0 fffff803`8589fc22     nt!KiDispatchException+0xd1a
13 ffffb681`2eca2fb0 fffff803`8589fbf0     nt!KxExceptionDispatchOnExceptionStack+0x12
14 ffffa30d`cff433d8 fffff803`858b3b3e     nt!KiExceptionDispatchOnExceptionStackContinue
15 ffffa30d`cff433e0 fffff803`858abd9b     nt!KiExceptionDispatch+0x13e
16 ffffa30d`cff435c0 fffff803`1bd7de34     nt!KiBreakpointTrap+0x35b
17 ffffa30d`cff43750 fffff803`1bd76db0     win_hv!win_hv::services::io_services::rw_msr+0x14

When the bp hits, that's the callstack and I'm not debugging the code that hit the breakpoint. Doing a g results in "busy". The machine doesn't crash. I can break again and I will be welcomed with same thing. But I still cannot debug it.

Fixed by setting bcdedit /debug off. For some reason ridtr or rgdtr always shows 0. Debugging is fine though.

1 Like

Today any of the breakpoints I have put started to result in EXCEPTION_IN_INVALID_STACK. The context record clearly shows RIP was in int 0x3. But instead of GDB catching the breakpoint, it just routes it to NT and I get a crash.

I believe you can set a hardware breakpoint, which fires on a match to a program counter which halts execution. Software breakpoints will insert a breakpoint instruction in the code. Windbg has a exdi passthough command that allows you to send non-standard commands to the gdb interface. Also note that if you don’t turn on the windows debugger in bcdedit, Windows may do some things that detect debugging, as security hardening. Enabling debugging but never attaching windbg can often allow an external debugger to avoid this. You could also try patching in a branch to self, and then when it hits manually halt execution from the qemu emulation side. Are you running emulated or native? Emulated is much slower but also software is always in control. You could also do side-by-side debugging, where you run windbg the normal way to a kdnet serial/network interface in the guest vm, under qemu, and also have a gdb debugger connected to the qemu gdb stub. You use windbg to figure out symbol addresses, so you can set hardware breakpoints using gdb. It’s a little painful but a lot less painful than debugging with no symbols. I have no idea what context your hypervisor runs in. Usually hypervisors have their own address space outside the OS, so am not clear how you would debug your hypervisor using windbg. Most debuggers are poorly prepared to handle multiple disjoint address spaces, except for OS kernel mode and user mode. On ARM64 there are at least two other address contexts, EL2 and EL3. Intel has SMM mode, which usually takes hardware debuggers to access, but not having done much x86 hypervisor work recently am not clear what context an x86 hypervisor runs in.

Side by side debugging freaks out windbg and crashes the machine. It's kvm, so native. It's a hypervisor that virtualizes an existing machine. So its on address space of kernel. Usually, it works. When you put a breakpoint in vmexit (even with kdnet), you see that its triggered. Because IDT stays same for kernel. So it just hits the kdnet like it would for any driver, even if thenterrupt handler code runs in hypervisor context. But as project gets big, the flaws start to crack out it seems.

I've been told to use hardware breakpoints as well. They are limited, but seems like we don't have another choice. Just for the sake of better KVM debugging, I started to modify KVM itself for a better debugging experience. I believe I can circumvent this gdb nonsense and directly use ioctls on KVM dricer to get/set software and hardware breakpoints. I would set exception bitmap to cause a vmexit when #BP is hit. So its an ongoing research.

Don’t use kvm use qemu running as an application. You’re currently doing nested virtualization. If you run qemu in software emulation mode, from a cpu viewpoint you are not doing nested virtualization and the qemu gdb interface is “outside” your hypervisor. If needed you can also hack the qemu emulation to have any behavior you want. I don’t have any experience doing side by side debugging on x86, in the past on arm64 I’ve had a jtag debugger, windbg to the kernel, and windbg to hyperv all side by side.

That is how it should be done. I need a real machine, but unfortunately, I don't have a modern machine I can jtag. Software emulation for windows is insanely slow