I am analyzing a kernel dump to detect a handle leak by a particular process.
I have given a command !handle 0 7 process_address file.
This list all the file handles and i am seeing around 15k handle with the name " \Endpoint {Afd}" are being created, these are winsock handles.
I want to find the irp/thread these handles are associated, that will help me to find the exact thread in the application. Could someone provide me the commands to figure it out?
Not sure you’re going to do better than just knowing the process, nothing says there even is an active IRP or thread to track it back to. Have you tried turning on handle tracing for the process?
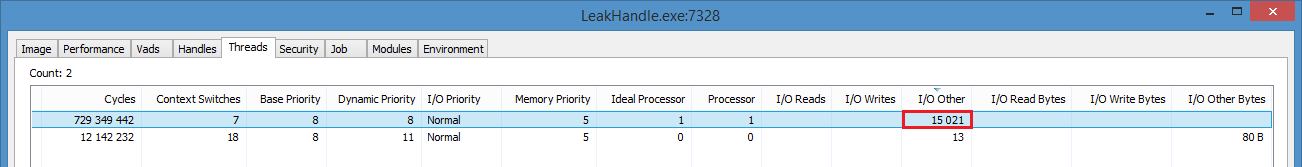
There is no 100% guarantee that you will pinpoint the thread that is leaking winsock handles using this approach, but you could try to run !dbgkit.ps (Andrey Bazhan - Web Solutions Tailored to your needs) command, open process’s properties dialog by double clicking on the process, open threads tab and then sort by I/O Other column.